CSD Oz Forecast
If I'm a 7 out of 10, that's the same as 3.5 out of 5. I probably wouldn't buy me on Amazon.
CSD

MENU
Oz Forecast
Enter Town Name:
Enter Town Name:

Victoria Weather Radar, Satellite and Lightning Map

Radar background
Victoria Radar Overlay
Radar
Molonglo Valley: 0.1mm (last 24 hours)Bungendore Village: 0.2mm (last 24 hours)Mount Boyce: 1.0mm (last 24 hours)Moss Vale: 0.2mm (last 24 hours)Nowra: 0.2mm (last 24 hours)Jervis Bay Airfield: 19.2mm (last 24 hours)Bankstown: 0.6mm (last 24 hours)Cape Jaffa: 0.2mm (last 24 hours)Mount Gambier: 0.6mm (last 24 hours)Cape Nelson: 0.4mm (last 24 hours)Hamilton: 0.8mm (last 24 hours)Port Fairy: 0.2mm (last 24 hours)Mount William: 0.2mm (last 24 hours)Warrnambool: 0.4mm (last 24 hours)Cape Otway: 2.0mm (last 24 hours)King Island Airport: 0.4mm (last 24 hours)Ballarat: 0.2mm (last 24 hours)Kilmore Gap: 0.2mm (last 24 hours)Mangalore: 0.2mm (last 24 hours)Frankston (Ballam Park): 0.2mm (last 24 hours)Pound Creek: 1.8mm (last 24 hours)Latrobe Valley: 0.2mm (last 24 hours)Rhyll: 1.2mm (last 24 hours)Wilsons Promontory: 1.4mm (last 24 hours)Yanakie: 1.0mm (last 24 hours)Cooma Airport: 0.6mm (last 24 hours)Canberra: 1.2mm (last 24 hours)Ulladulla: 15.2mm (last 24 hours)Nerriga: 0.6mm (last 24 hours)Hogan Island: 0.2mm (last 24 hours)Holsworthy (Defence): 5.0mm (last 24 hours)Lucas Heights (Ansto): 1.8mm (last 24 hours)Sydney Olympic Park: 8.6mm (last 24 hours)Robe Airport: 0.8mm (last 24 hours)Dartmoor: 0.4mm (last 24 hours)Edenhope: 0.2mm (last 24 hours)Westmere: 0.6mm (last 24 hours)East Sale Airport: 0.2mm (last 24 hours)Bega: 0.2mm (last 24 hours)Moruya Airport: 0.2mm (last 24 hours)Point Perpendicular: 10.2mm (last 24 hours)Portable NSW RFS 20 (Stanwell Tops): 2.0mm (last 24 hours)Portable NSW RFS 21 (Plumpton): 0.2mm (last 24 hours)Portable NPWS NSW05 (Glenbrook): 2.4mm (last 24 hours)Glenburn (Cfa): 0.2mm (last 24 hours)Trunkey (Old Post Office): 0.2mm (last 24 hours)Faulconbridge (Great Western Hwy): 2.0mm (last 24 hours)Bilpin (Fern Grove): 11.0mm (last 24 hours)Oberon (Jenolan Caves Road): 1.0mm (last 24 hours)Audley  (Royal National Park): 4.0mm (last 24 hours)Hornsby (Swimming Pool): 0.2mm (last 24 hours)Shanes Park (South Creek Road): 0.2mm (last 24 hours)Seven Hills  (Radio Fm 103.2): 7.0mm (last 24 hours)North Rocks (Muirfield Golf Club): 2.0mm (last 24 hours)Kentlyn (Georges River Road): 1.0mm (last 24 hours)Hampden Bridge (Kangaroo River): 3.0mm (last 24 hours)Touga: 0.2mm (last 24 hours)Brooman (Carisbrook): 4.2mm (last 24 hours)Mongarlowe (Leweston): 2.4mm (last 24 hours)Dalton (Hillview): 0.4mm (last 24 hours)Bowning (Wanganui): 0.2mm (last 24 hours)Strathbogie North: 0.2mm (last 24 hours)Mount Buffalo Chalet: 0.2mm (last 24 hours)Wonnangatta River @ Waterford: 0.4mm (last 24 hours)Mount Delegate: 0.2mm (last 24 hours)Balook: 0.2mm (last 24 hours)Mount Useful: 0.2mm (last 24 hours)Mitchell River @ Glenaladale: 0.2mm (last 24 hours)Mount Tamboritha: 0.2mm (last 24 hours)Reeves Knob: 0.4mm (last 24 hours)Jeeralang North: 0.2mm (last 24 hours)Moe South: 0.2mm (last 24 hours)Marysville Golf Course: 0.2mm (last 24 hours)Strath Creek: 0.2mm (last 24 hours)Mount Sabine: 0.8mm (last 24 hours)Mount Cowley: 0.2mm (last 24 hours)Boonah: 0.2mm (last 24 hours)Webbs Ck-Wisemans Ferry (Hawkesbury River): 1.4mm (last 24 hours)Colo Heights (Sawmill): 0.4mm (last 24 hours)Shooters Hill (Tower Road): 0.2mm (last 24 hours)Linden (Woodford Creek Dam): 0.5mm (last 24 hours)Wentworth Falls (Bodington): 2.0mm (last 24 hours)Rock Forest (Macquarie River): 0.5mm (last 24 hours)Parramatta (Valentine Avenue): 3.5mm (last 24 hours)Woronora Dam (Aws): 4.5mm (last 24 hours)Auburn (Rosnay Golf Club): 3.0mm (last 24 hours)Guildford (Woodville Golf Club): 7.0mm (last 24 hours)Lidcombe (Carnarvon Golf Club): 6.0mm (last 24 hours)Greystanes (Cumberland Golf Club): 1.0mm (last 24 hours)West Pennant Hills (Cumberland State Forest): 0.5mm (last 24 hours)Northmead Bowling Club: 1.5mm (last 24 hours)Maroota (Tobruk): 0.6mm (last 24 hours)Merrylands West (Finlayson Creek): 0.5mm (last 24 hours)Sackville: 0.2mm (last 24 hours)Tomerong (Eucalypt Lane): 13.0mm (last 24 hours)Reverces: 0.5mm (last 24 hours)Bumbulla: 0.2mm (last 24 hours)Smallwoods Crossing (Nattai River): 0.5mm (last 24 hours)Tallong (Throsby Point): 1.0mm (last 24 hours)Vincentia: 10.0mm (last 24 hours)Cleveland Road: 0.5mm (last 24 hours)Dombarton Loop: 0.5mm (last 24 hours)Greenwell Point: 6.0mm (last 24 hours)Lake Conjola: 16.0mm (last 24 hours)Island Point Rd (St Georges Basin): 8.5mm (last 24 hours)Fishermans Repeater: 11.0mm (last 24 hours)Tomerong Creek: 18.0mm (last 24 hours)Glennely Ck: 1.0mm (last 24 hours)Jerrawangala: 25.0mm (last 24 hours)Foxground: 2.0mm (last 24 hours)Currarong: 9.0mm (last 24 hours)Broughton Creek: 5.0mm (last 24 hours)Macquarie Pass (Nurrewin): 0.5mm (last 24 hours)Durran Durra: 0.5mm (last 24 hours)Brogo Dam: 0.2mm (last 24 hours)Brooman (Clyde River): 0.2mm (last 24 hours)Ulladulla: 20.0mm (last 24 hours)Lake Tabourie: 17.0mm (last 24 hours)Burrill Lake: 14.0mm (last 24 hours)Burra (Burra Creek): 0.2mm (last 24 hours)Corin Dam (Boat Ramp): 0.2mm (last 24 hours)Bullamalita: 8.0mm (last 24 hours)Oranmeir: 0.5mm (last 24 hours)Jingera (Hillside): 0.2mm (last 24 hours)Bendora Dam: 0.2mm (last 24 hours)Tinderry (Queanbeyan River): 0.2mm (last 24 hours)Wickerslack (Queanbeyan River): 0.8mm (last 24 hours)Carwoola (Molonglo River): 0.2mm (last 24 hours)Tooma Dam: 24.2mm (last 24 hours)Glenroy No:2 (Mannus Creek): 0.2mm (last 24 hours)Buffalo River At Lake Buffalo D/S: 0.2mm (last 24 hours)Dargo River @ Lower Dargo Road: 0.2mm (last 24 hours)Thomson-Yarra Divide: 0.2mm (last 24 hours)Traralgon Ck At Traralgon South: 0.4mm (last 24 hours)Macalister River @ Stringybark Creek: 0.2mm (last 24 hours)Mount Tassie: 0.2mm (last 24 hours)

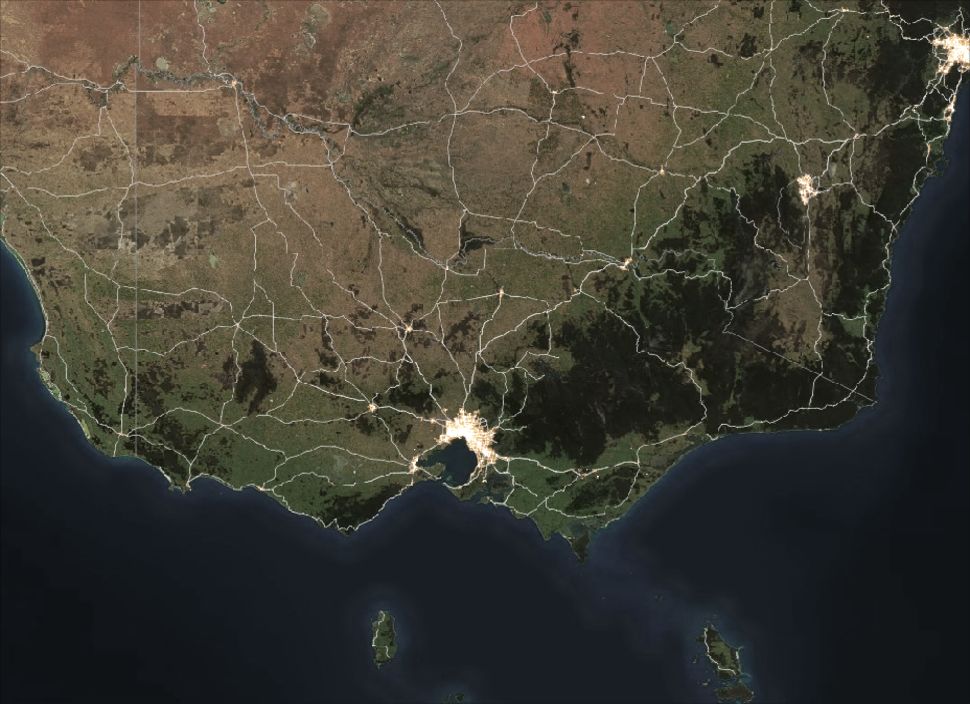
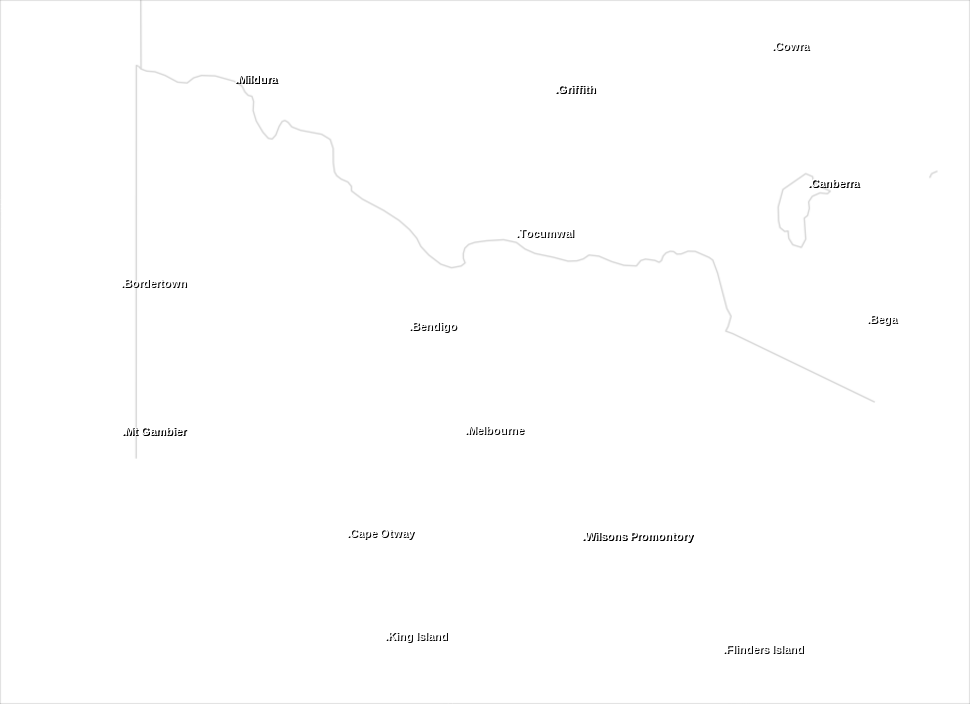
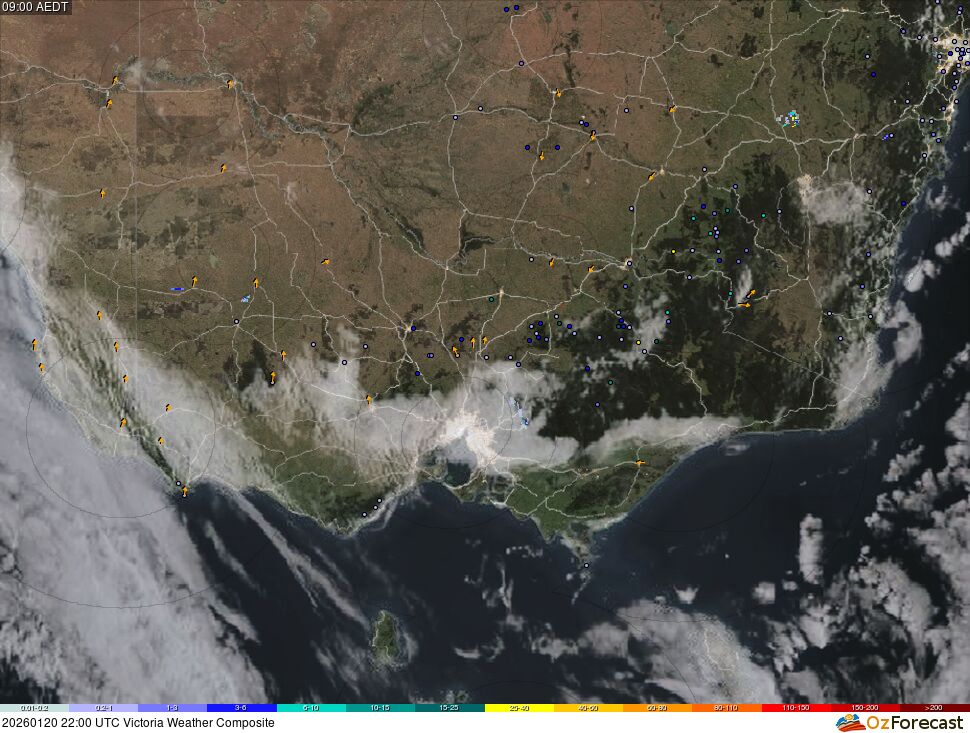
This Victoria storm tracker displays the fusion of radar, satellite, bushire hotspot detections, lightning and surface observations. The background map is actual true-colour imagery from low earth orbit satellites from recent days and will update automatically. Some areas may appear grey if no recent imagery is available, e.g. due to persistent cloud cover or bushfire smoke. Detected lightning is shown by yellow lightning icons. Arrows represent wind speed and direction observations from ground-based weather stations, with red arrows showing wind gusts >65km/h, while the small coloured dots indicate weather station rainfall measurements over the previous 24 hour period, in millimetres, according to the scale at the bottom. You may hover the mouse over these coloured dots or click for additional weather information. The weather radar reflectivity data, which also follows the colour sequence legend at the bottom, is a composite from multiple Bureau of Meteorology (BOM) weather radar sites. Real-time satellite cloud imagery is originally processed by the BOM from the geostationary satellite Himawari-9 operated by the Japan Meteorological Agency. Fire hotspots detections are included from four spacecraft, courtesy of NASA and JAXA. Older hotspots will appear as orange while real-time detections will be coloured red. Less intense fires are displayed as more transparent.

This information is automatically generated, is not quality controlled and may not update in a timely manner. You accept all risks and responsibility for losses, damages, costs and other consequences resulting directly or indirectly from using this site and any information or material available from it.