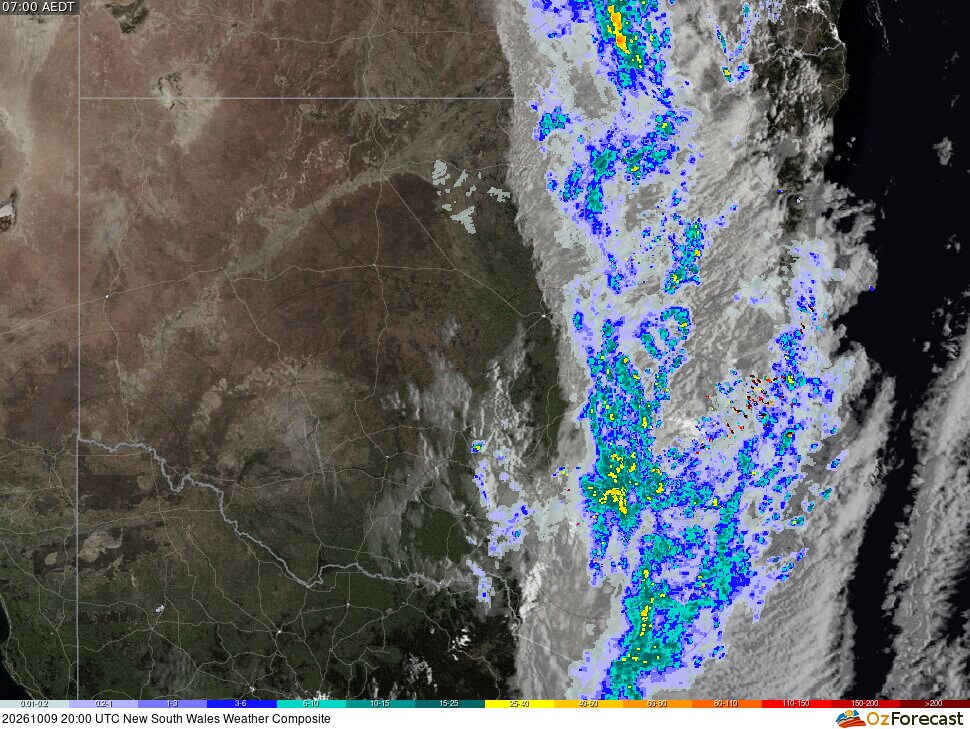
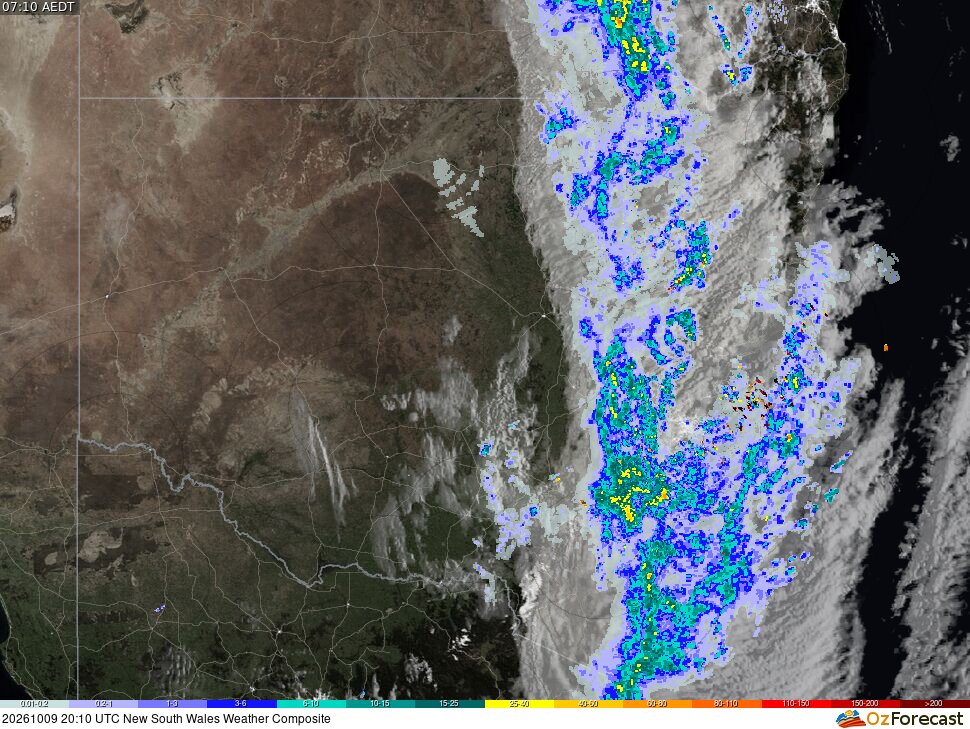
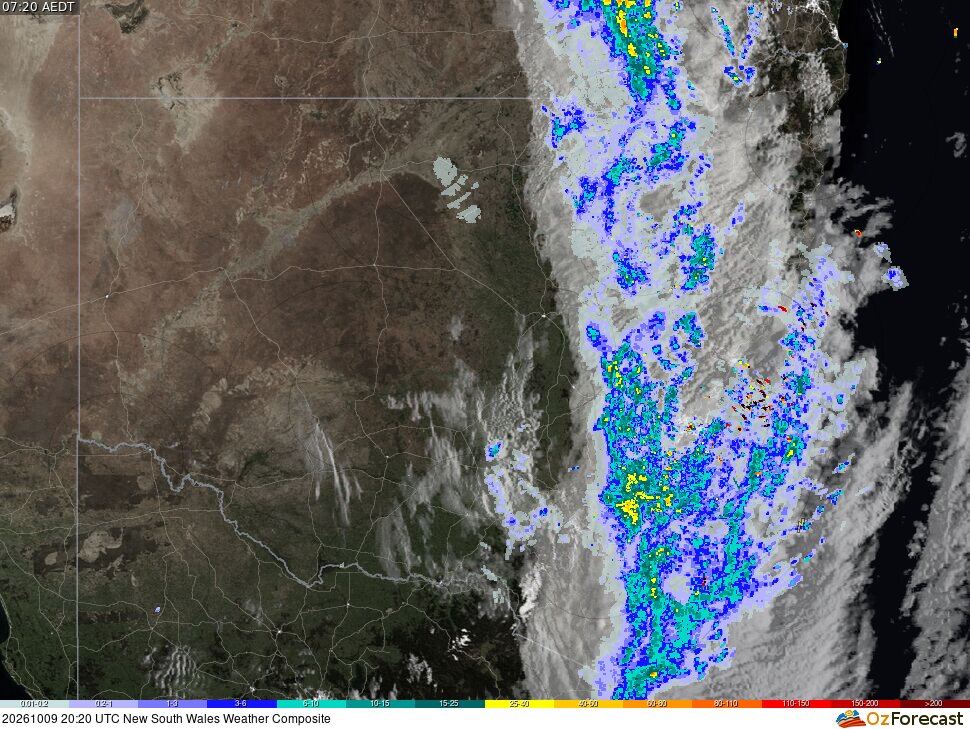
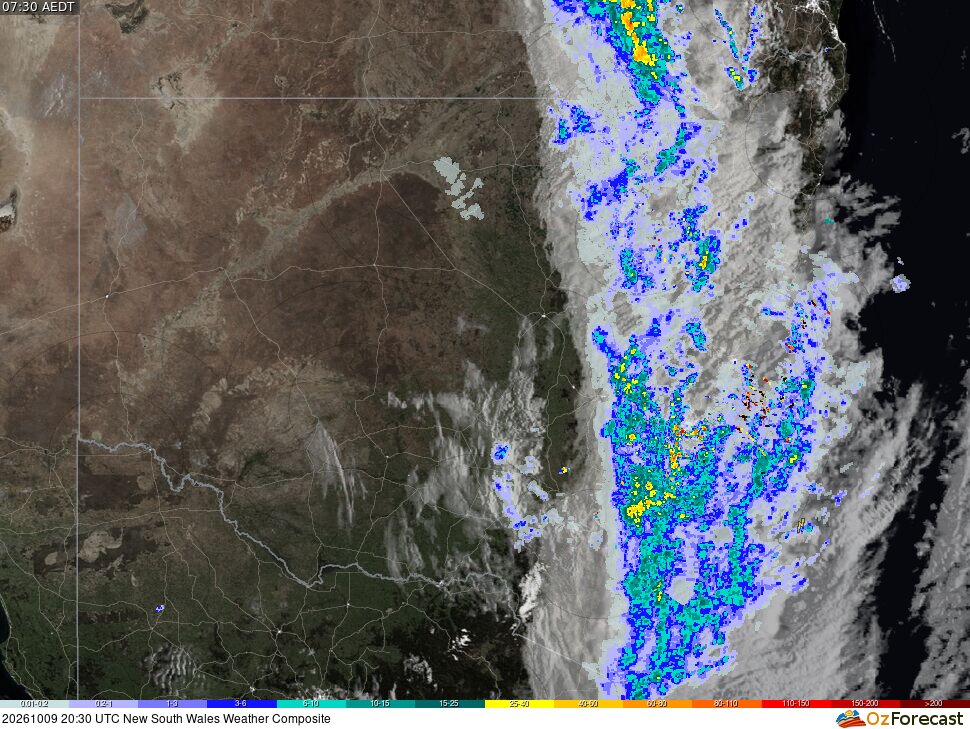
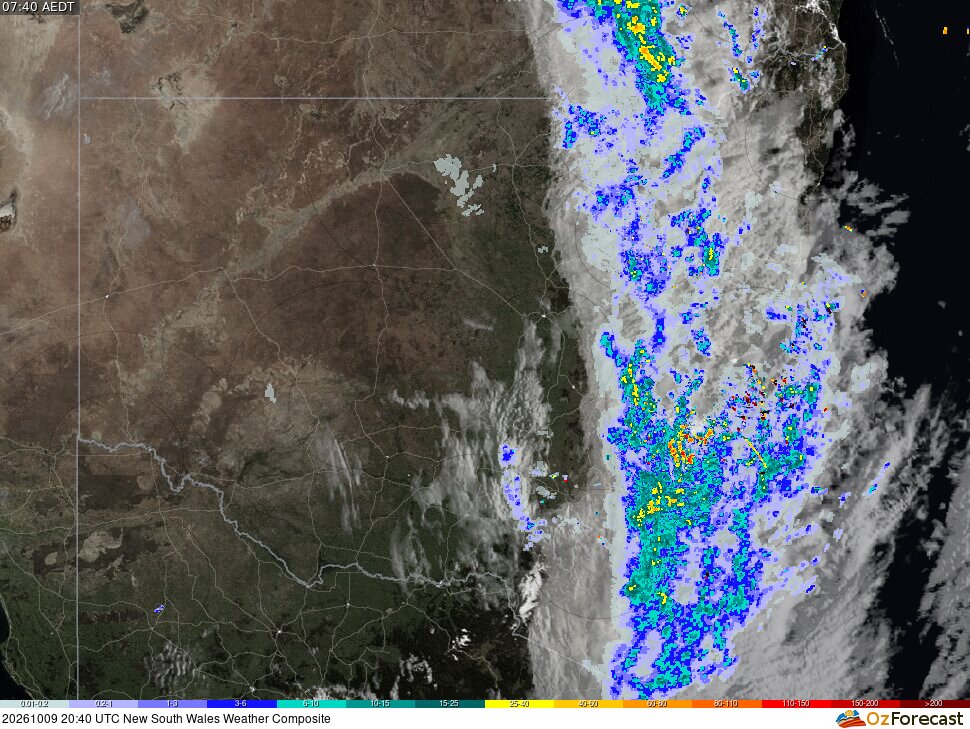
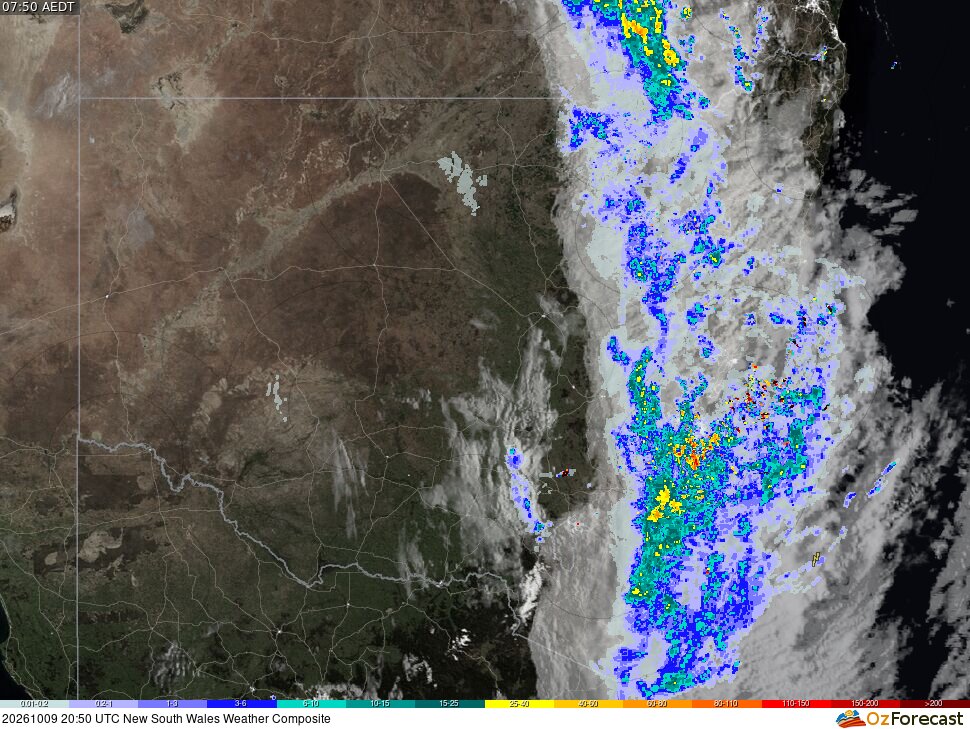
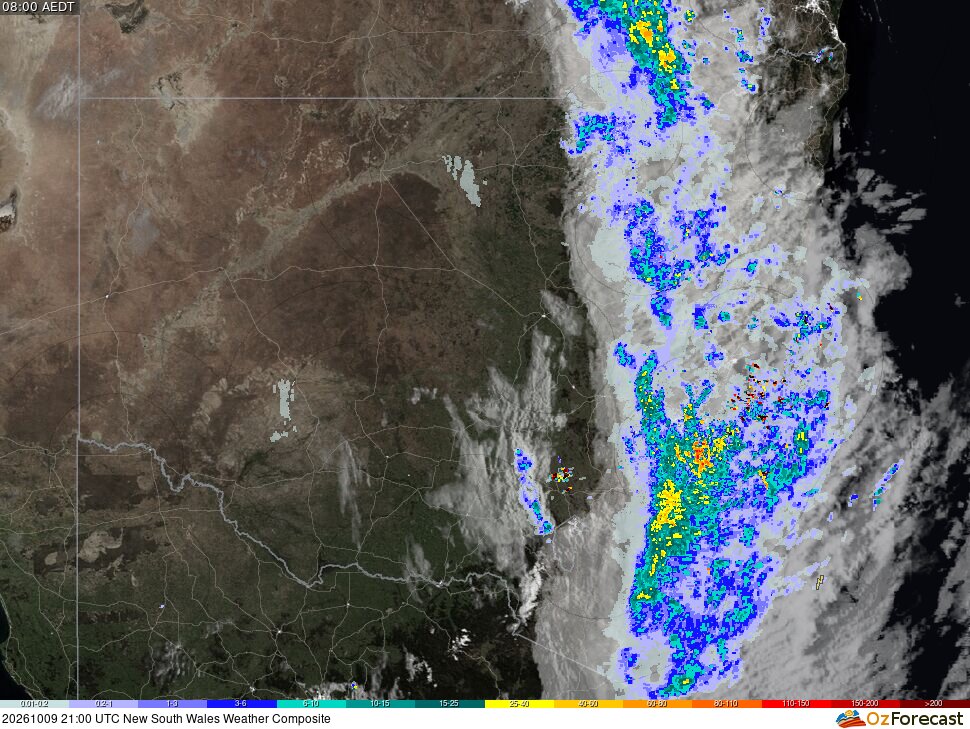
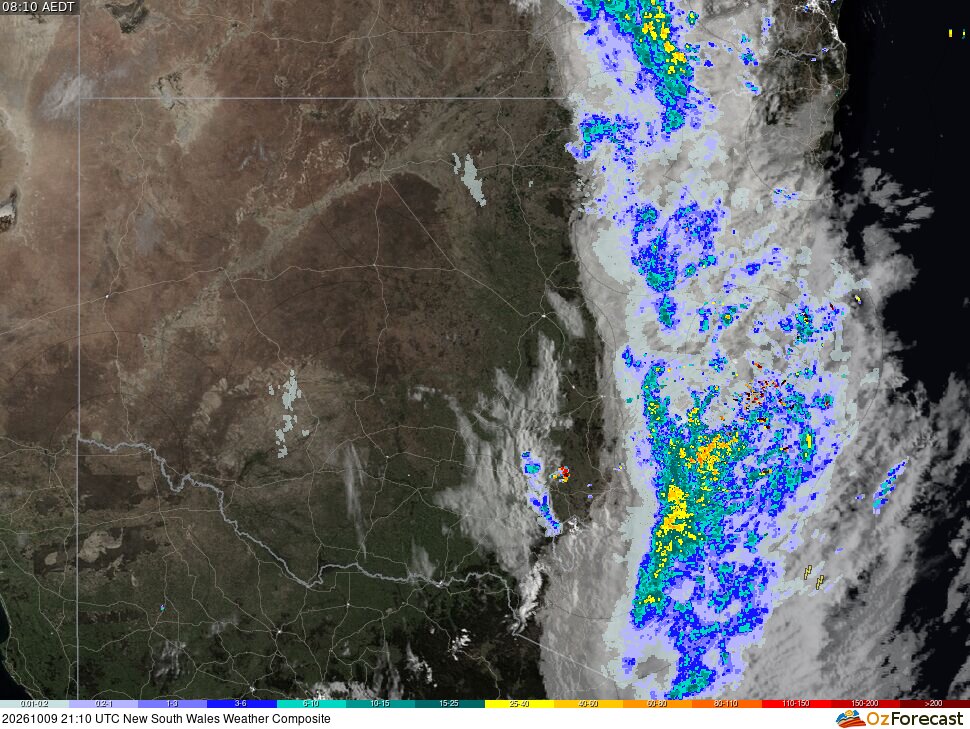
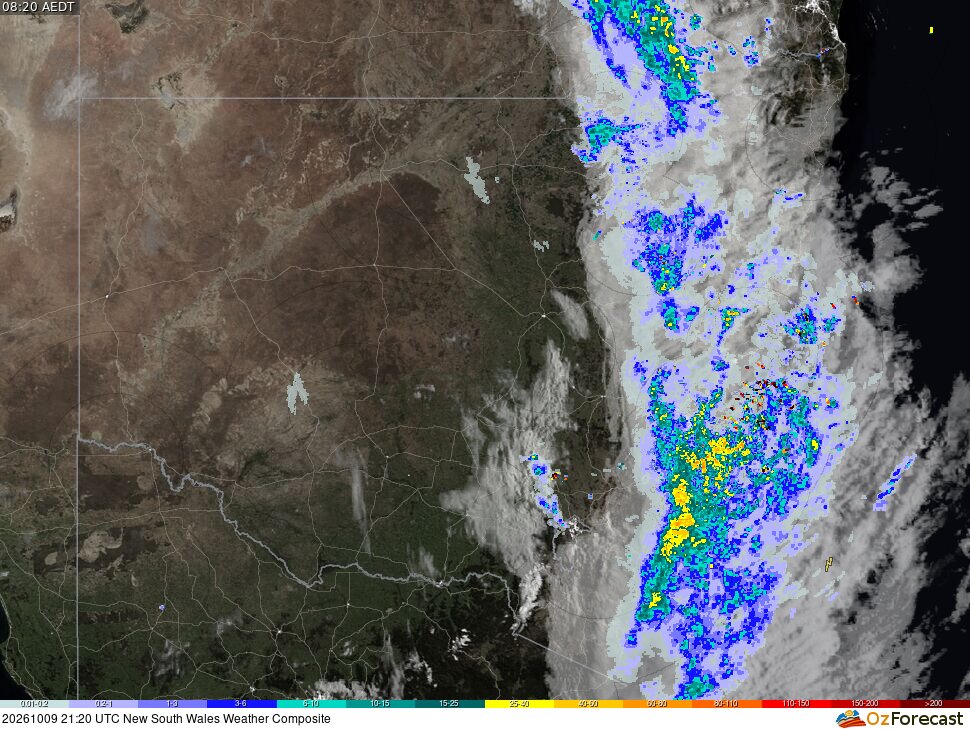
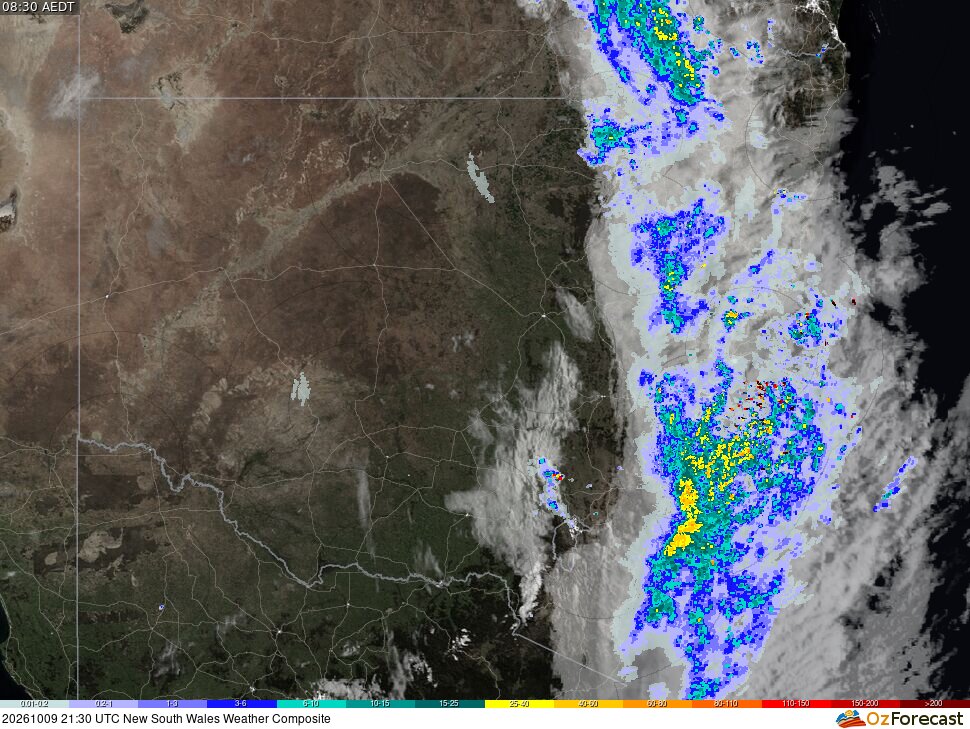
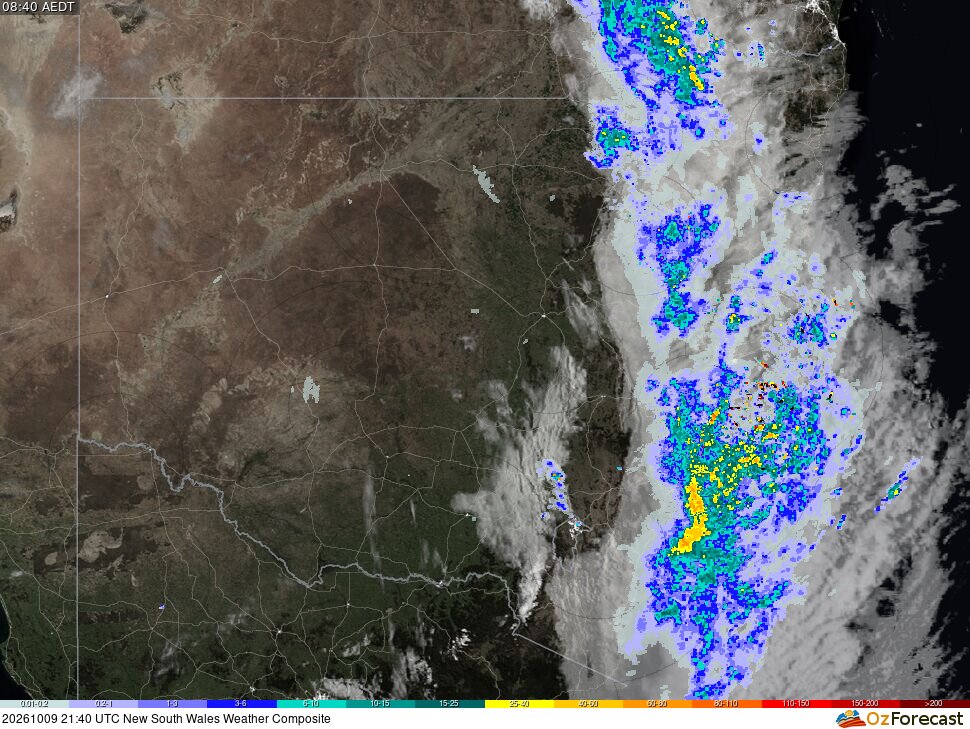
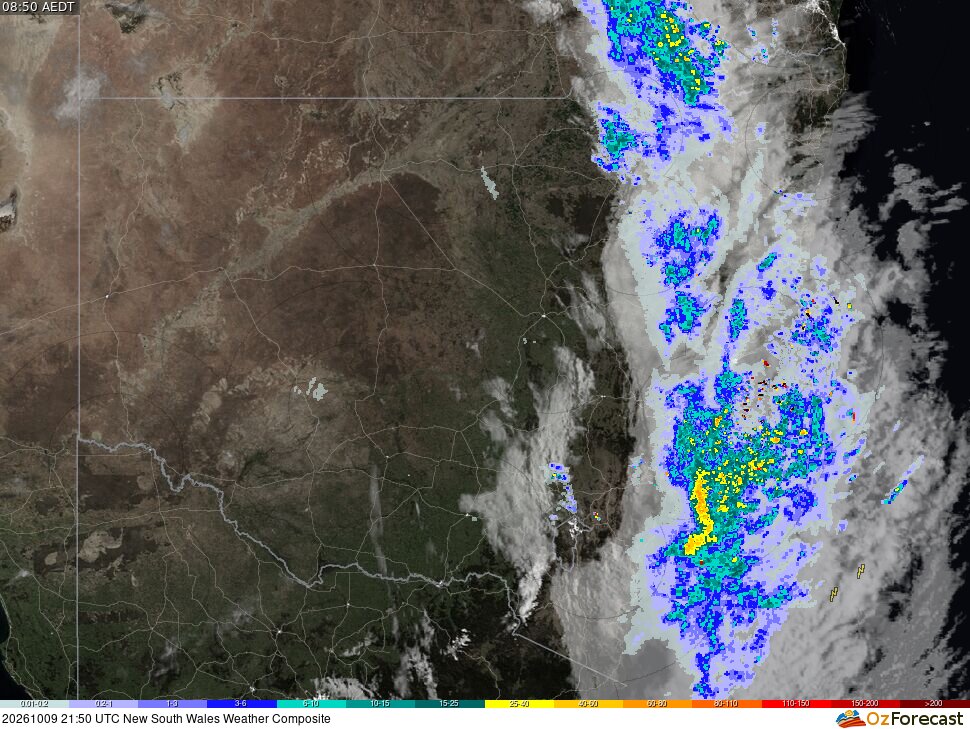
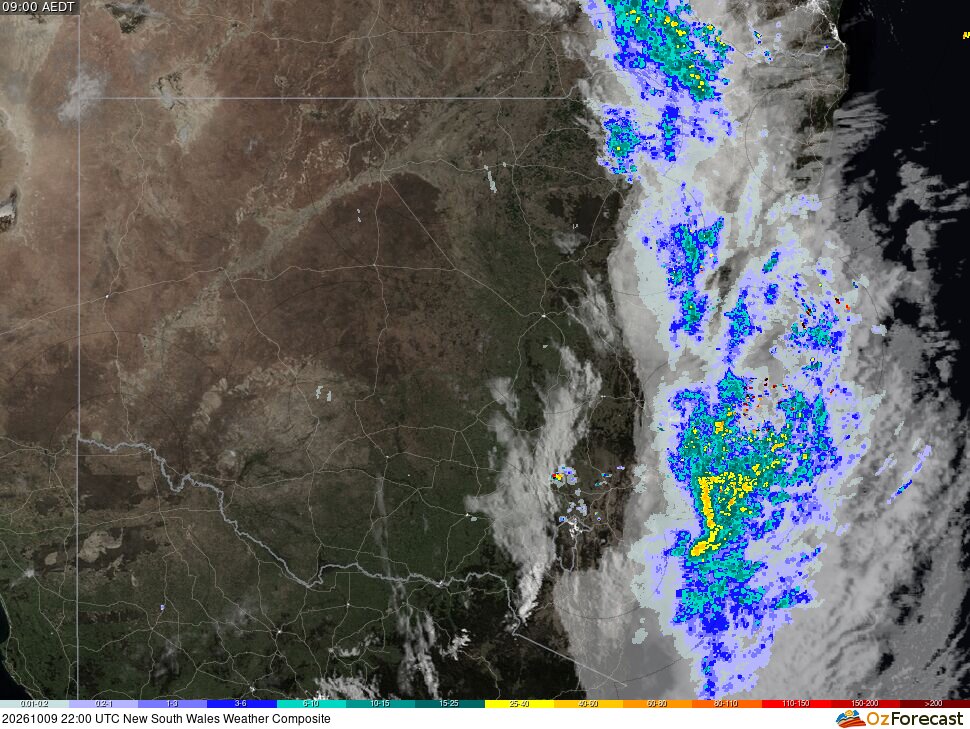
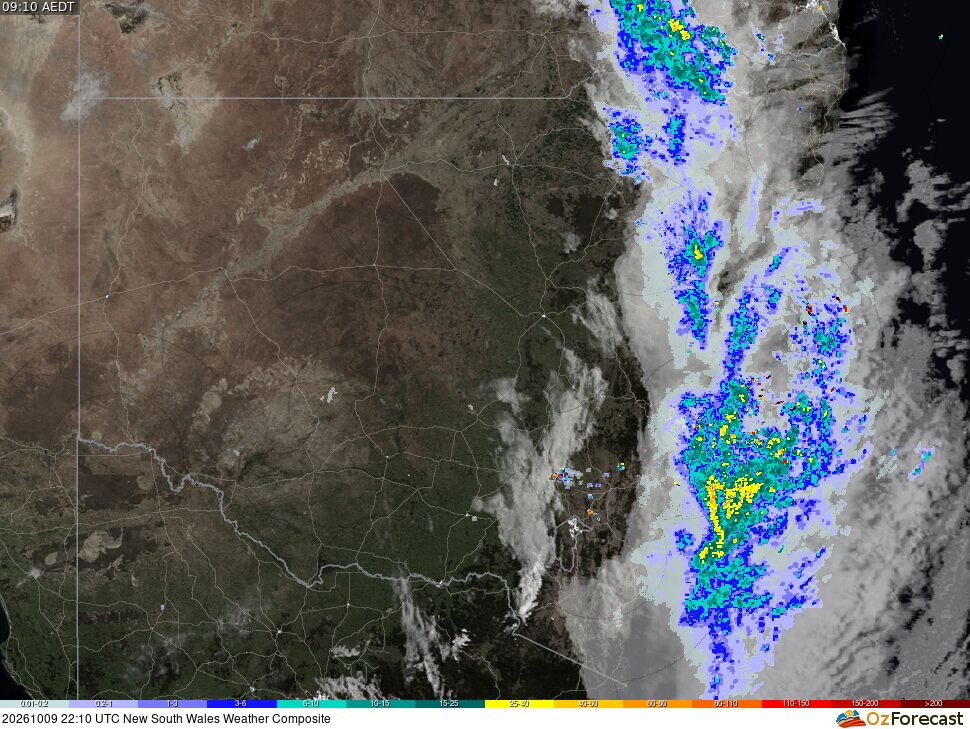
This New South Wales storm tracker displays the fusion of radar, satellite, bushfire hotspot detections, lightning and surface observations. The background map is satellite-derived reference imagery used to provide geographic context. Detected lightning is shown by yellow lightning icons. Arrows represent wind speed and direction observations from ground-based weather stations, with red arrows showing wind gusts >65km/h, while the small coloured dots indicate weather station rainfall measurements over the previous 24 hour period, in millimetres, according to the scale at the bottom. You may hover the mouse over these coloured dots or click for additional weather information. The weather radar reflectivity data, which also follows the colour sequence legend at the bottom, is a composite from multiple Bureau of Meteorology (BOM) weather radar sites. Real-time satellite cloud imagery is originally processed by the BOM from the geostationary satellite Himawari-9 operated by the Japan Meteorological Agency. Recent corroborated fire hotspot detections are shown in red and come from six spacecraft operated by NASA, NOAA and JAXA; isolated detections are omitted from this general weather display. Less intense fires are displayed as more transparent.
This information is automatically generated, is not quality controlled and may not update in a timely manner. You accept all risks and responsibility for losses, damages, costs and other consequences resulting directly or indirectly from using this site and any information or material available from it.